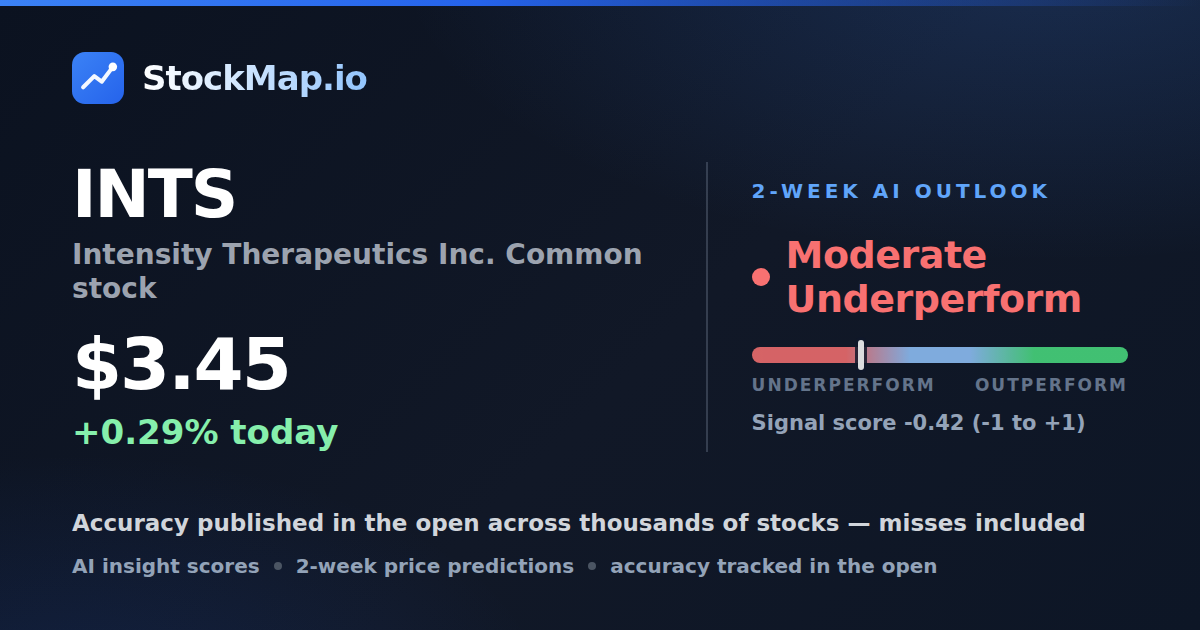
Intensity Therapeutics Inc. Common stock (INTS) Stock Forecast: StockMap's 2-Week Call
INTS stock forecast: StockMap's model calls Intensity Therapeutics Inc. Common stock Strong Underperform for the two weeks after the Nov 19 close: it expects INTS to trail the growth index. It is a call on the gap, not a price target. Right in 4 of 6 two-week windows on INTS since Aug 21; by chance, a call on the same dates was right 59% of the time.
Intensity Therapeutics Inc. Common stock last closed at $2.50, -5.30% on the session.
Against the IVW growth benchmark the position is -2.97% over the forecast window.
Intensity Therapeutics Inc. Common stock's market cap is $8.25M as of November 19, 2026.
Calls down ↘: the model's call · the next 2 weeks, vs S&P 500 growth. The lean on a scale from −100 to +100 is -63 (behind).
Where INTS sits: sized by market cap, coloured by the day's move.
The read is built from 15 underlying insights — 1 bullish and 14 bearish.
Agreement across those insights is 93%.
49 daily calls for INTS so far. We publish our accuracy across thousands of stocks in the open, misses included — no per-stock hit rate is claimed on a small sample.
On the fundamentals StockMap ranks Intensity Therapeutics Inc. Common stock in the 8th percentile on return on equity, where 100 is best.
Intensity Therapeutics Inc. Common stock is classified under Health Care / Biotechnology.
StockMap tracks Intensity Therapeutics Inc. Common stock as the 364th largest of the 394 companies it covers in the Biotechnology industry, part of the Health Care sector.
Across that group the current two-week reads are 200 Moderate Underperform, 134 Neutral, 43 Strong Underperform and 17 Moderate Outperform.
On that composite Intensity Therapeutics Inc. Common stock ranks 382nd of 394 in the group, against a group median of -0.27.