Stock Yards Bancorp (SYBT) Stock Forecast — 2-Week Outlook
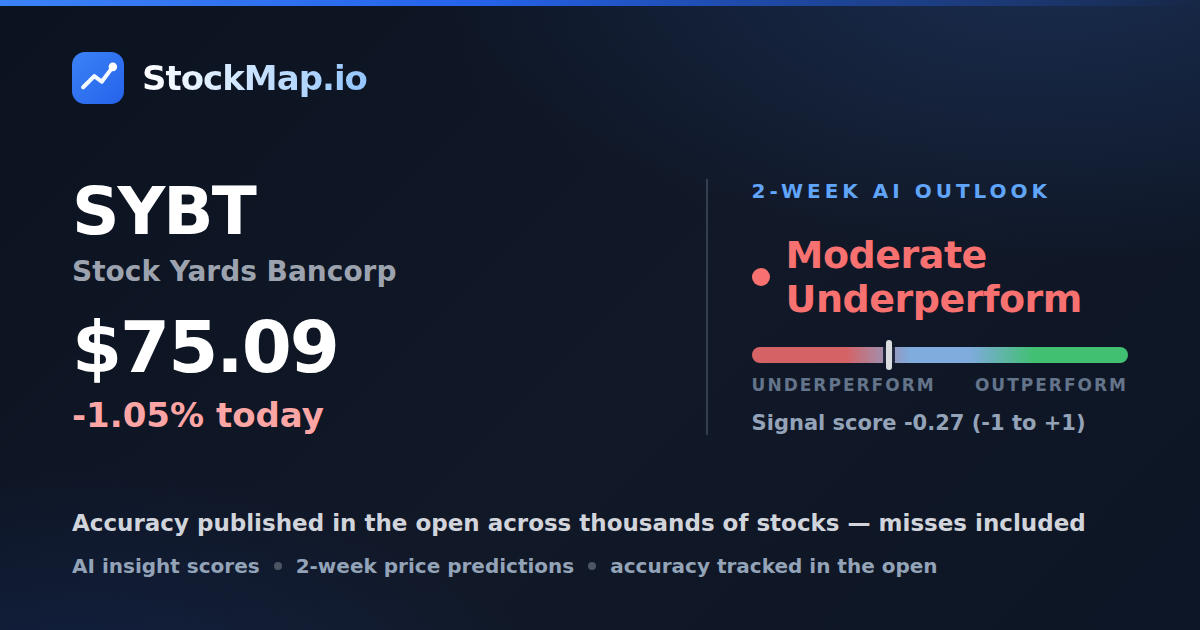
StockMap's current 2-week read on Stock Yards Bancorp (SYBT) is Moderate Underperform.
The composite score behind that read is -0.27, weighing +0.07 of bullish evidence against -0.53 bearish.
Stock Yards Bancorp last closed at $75.09, -1.05% on the session.
Against the IVW growth benchmark the position is -1.85% over the forecast window.
The read is built from 14 underlying insights — 1 bullish and 13 bearish.
Agreement across those insights is 93%.
20 graded predictions for SYBT so far. We publish our accuracy across thousands of stocks in the open, misses included — no per-stock hit rate is claimed on a small sample.
On the fundamentals StockMap ranks Stock Yards Bancorp in the 62nd percentile on valuation and the 69th percentile on return on equity, where 100 is best.
Stock Yards Bancorp is classified under Financials / Banks, with a market capitalisation of $2.36B.
StockMap tracks Stock Yards Bancorp as the 110th largest of the 312 companies it covers in the Banks industry, part of the Financials sector.
Across that group the current two-week reads are 299 Neutral, 9 Moderate Underperform and 4 Moderate Outperform.
On that composite Stock Yards Bancorp ranks 312th of 312 in the group, against a group median of -0.06.