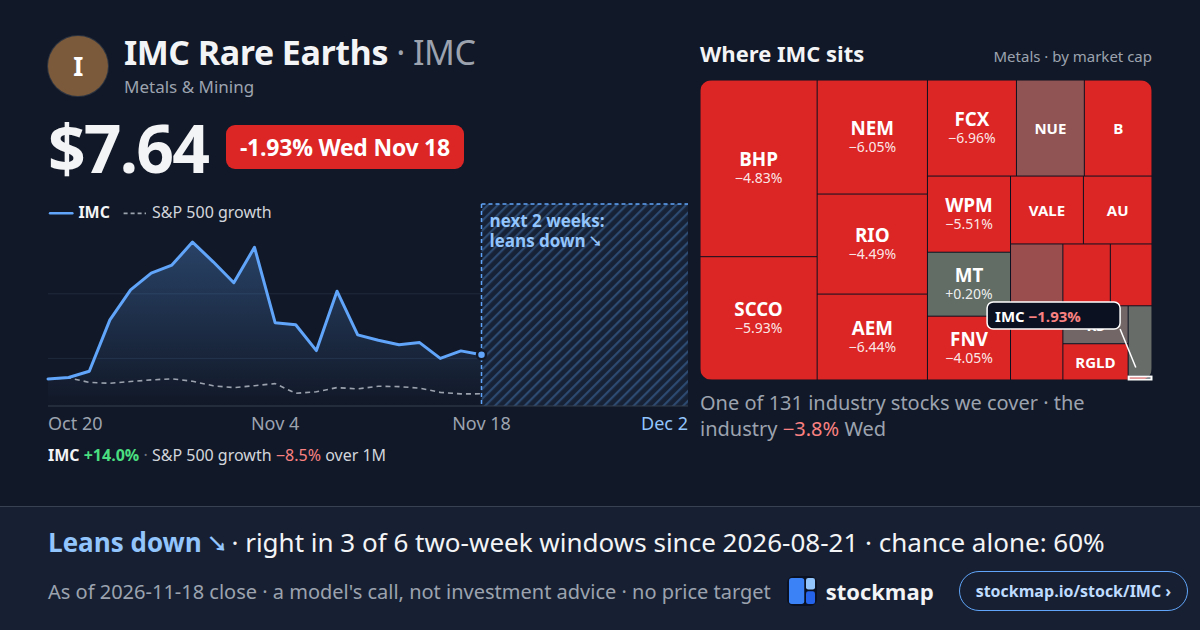
IMC Rare Earths (IMC) Stock Forecast: StockMap's 2-Week Call
IMC stock forecast: StockMap's model calls IMC Rare Earths Strong Underperform for the two weeks after the Nov 18 close: it expects IMC to trail the growth index. It is a call on the gap, not a price target. Right in 3 of 6 two-week windows on IMC since Aug 21; by chance, a call on the same dates was right 60% of the time.
IMC Rare Earths last closed at $7.64, -1.93% on the session.
Against the IVW growth benchmark the position is -1.95% over the forecast window.
IMC Rare Earths' market cap is $807.51M as of November 18, 2026.
Calls down ↘: the model's call · the next 2 weeks, vs S&P 500 growth. The lean on a scale from −100 to +100 is -66 (behind).
Where IMC sits: sized by market cap, coloured by the day's move.
The read is built from 11 underlying insights — 1 bullish and 10 bearish.
Agreement across those insights is 91%.
42 daily calls for IMC so far. We publish our accuracy across thousands of stocks in the open, misses included — no per-stock hit rate is claimed on a small sample.
IMC Rare Earths is classified under Materials / Metals & Mining.
StockMap tracks IMC Rare Earths as the 80th largest of the 131 companies it covers in the Metals & Mining industry, part of the Materials sector.
Across that group the current two-week reads are 83 Moderate Underperform, 25 Strong Underperform, 22 Neutral and 1 Moderate Outperform.
On that composite IMC Rare Earths ranks 123rd of 131 in the group, against a group median of -0.33.